- Plots presented in Henriques2015a
- Plots presented in the supplementary material
- Additional Plots
This page has download links for all the theoretical properties and combined observational
data plotted in the paper and a description of the figures.
As in the paper, all theoretical stellar masses have been convolved with a
gaussian in log(M*), with width increasing with redshift, in order to
account for the uncertainties in observational stellar mass determinations.
The scatter is assumed to have similar redshift dependence to that found by
Ilbert et al. 2013, but larger size (a gaussian with dispersion 0.08x(1+z)
instead of 0.04x(1+z)). This is still considerably smaller than found by
Conroy et al. 2009 even neglecting IMF uncertainties (0.3 at z=0 and 0.6 at z=2).
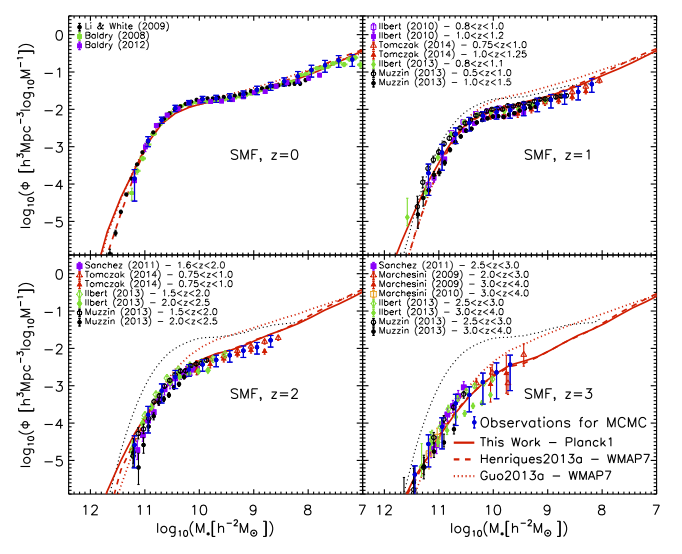
All stellar masses derived from observations using Bruzual and Charlot 2003
stellar populations at z>=1 have been corrected by -0.14 dex. This is
the conversion from masses derived with Bruzual and Charlot 2003 to
Maraston 2005 found by Sanchez et al. 2011.
We find good convergence between predictions based on the Millennium and
MillenniumII simulations for all galaxies with log(M*)>9.5. In all plots the
Millennium Simulation was used to derive properties for galaxies with
log(M*)>9.5 and the Millennium-II to derive properties at lower
mass.
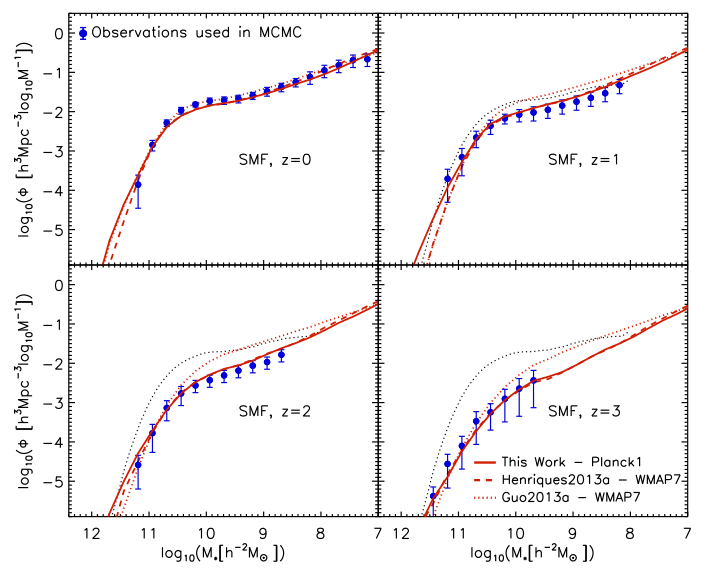 |
Henriques2015a SMF:
H15a_SMF.txt
Henriques2013 SMF: H13_SMF.txt
Guo2013 SMF: Guo13_SMF.txt
Combined observational SMF (blue symbols): Obs_SMF.txt
|
 |
 |
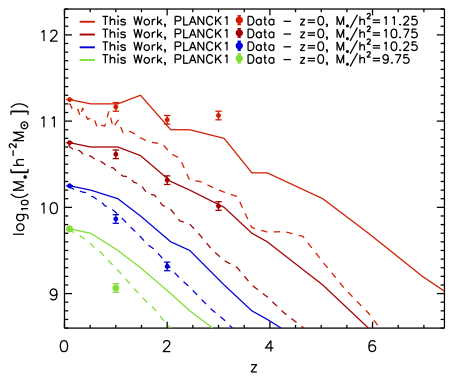 |
Henriques2015a mass growth using match in cumulative number density:
H15_mass_growth_cnd.txt
Henriques2015a true mass growth: H15_mass_growth_true.txt
Observed mass growth matching cumulative number densities from the combined stellar mass functions: Obs_mass_growth_cnd.txt
|
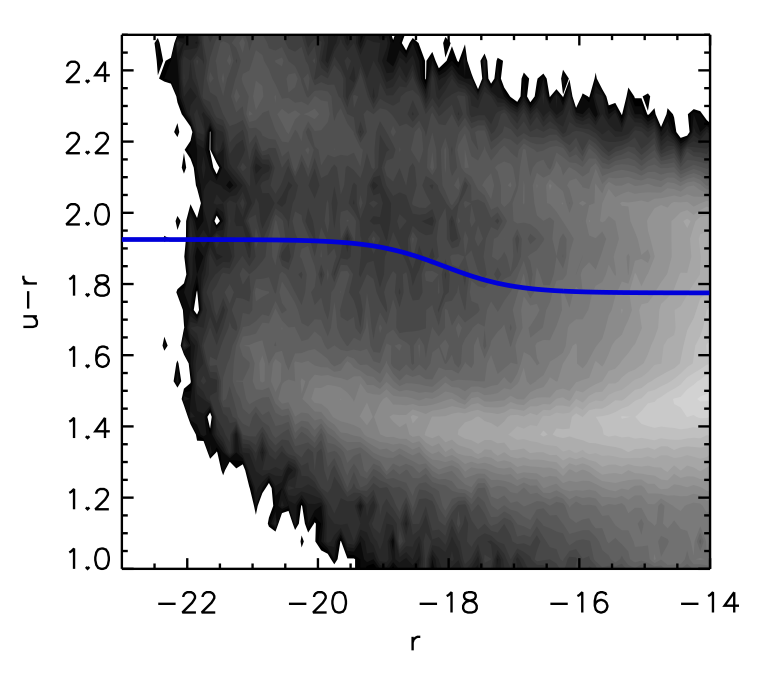
Observational quiescent cut: u-r>1.85-0.075 x tanh((Mr+18.07)/1.09)
| Observational quiescent cut:
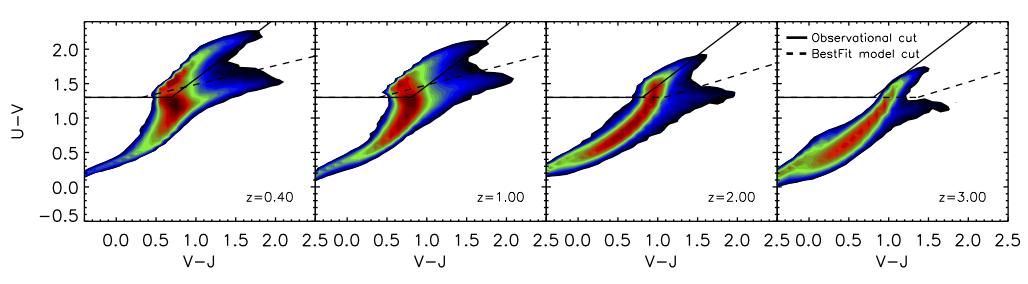
U-V > 1.3 +
|
Theoretical quiescent cut:
U-V > 1.3 +
|
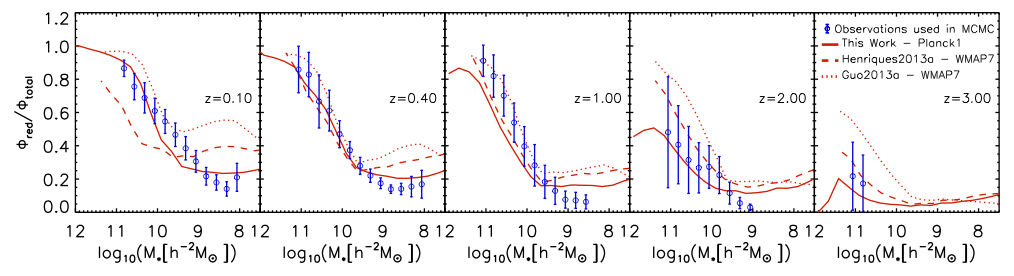
Henriques2015a red fraction: |
Henriques2013 red fraction: |
Guo2013 red fraction: |
Combined Observations: |
| H15_redfrac.txt |
H13_redfrac.txt |
Guo13_redfrac.txt |
Obs_redfrac.txt |
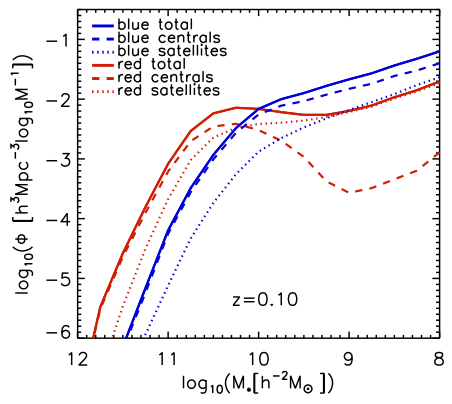 |
Henriques2015a SMFs red galaxies:
H15_smf_red.txt
H15_smf_red_centrals.txt
H15_smf_red_satellites.txt
Henriques2015a SMFs blue galaxies: H15_smf_blue.txt
H15_smf_blue_centrals.txt
H15_smf_blue_satellites.txt
|
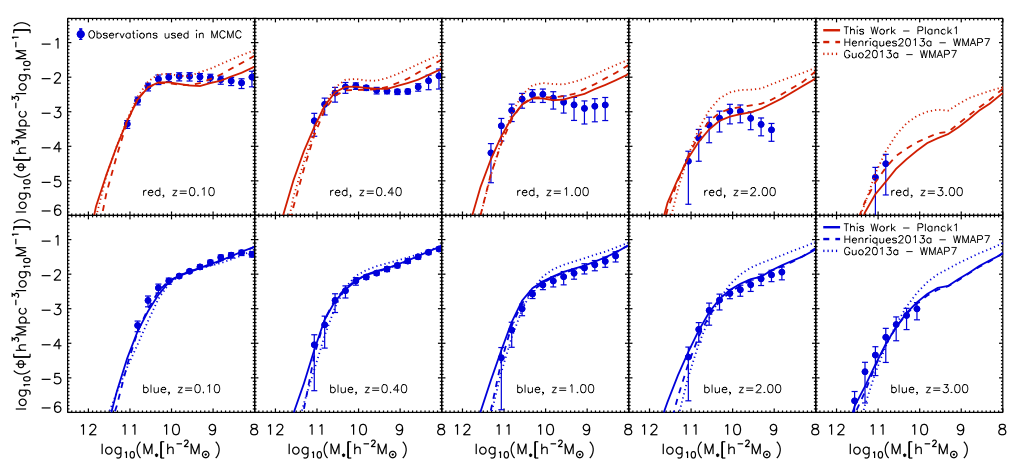
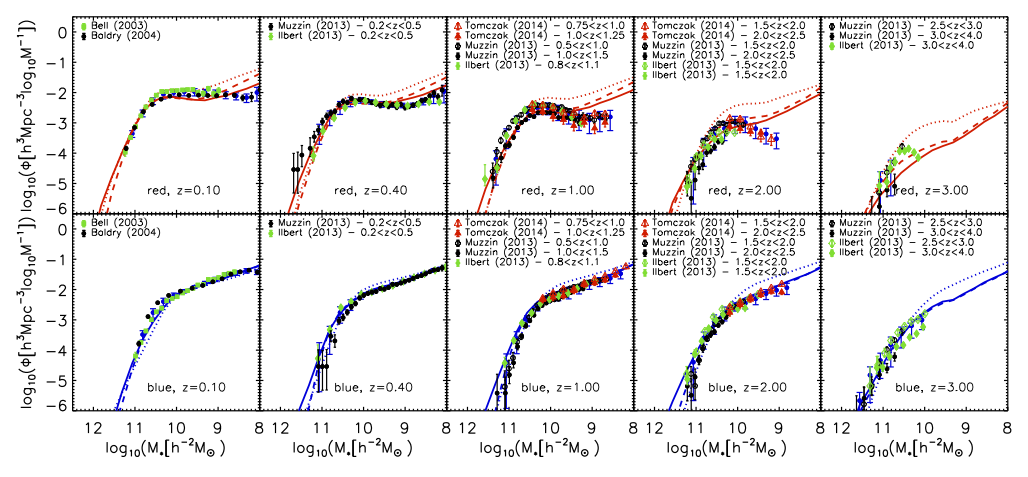
Stellar Mass Function of Red Galaxies:
| Henriques2015a SMF red: | Henriques2013 SMF red: | Guo2013 SMF red: | Combined observations SMF red: |
| H15_smf_red.txt |
H13_smf_red.txt |
Guo13_smf_red.txt |
Obs_smf_red.txt |
Stellar Mass Function of Blue Galaxies:
| Henriques2015a SMF blue: | Henriques2013 SMF blue: | Guo2013 SMF blue: | Combined observations SMF blue: |
| H15_smf_blue.txt |
H13_smf_blue.txt |
Guo13_smf_blue.txt |
Obs_smf_blue.txt |
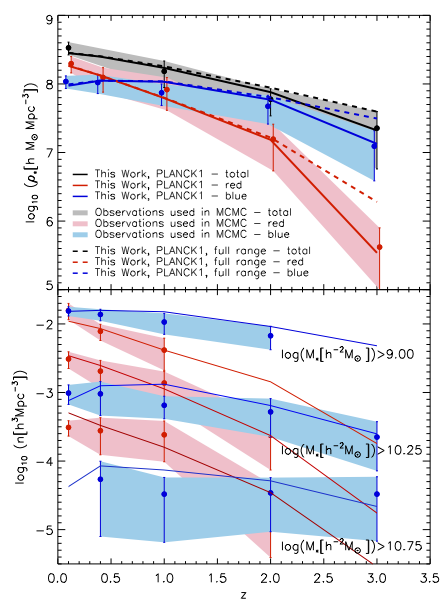 |
Integrated Stellar Mass density: Henriques2015a obs range (dashed): H15_SMD_total.txt
H15_SMD_red.txt
H15_SMD_blue.txt
Henriques2015a full range (solid):
H15_SMD_total_fullrange.txt
H15_SMD_red_fullrange.txt
H15_SMD_blue_fullrange.txt
Combined observations (symbols and regions)::
Obs_SMD_total.txt
Obs_SMD_red.txt
Obs_SMD_blue.txt
Cumulative Number Density: Henriques2015a: H15_integrated_ND_evo_red.txt
H15_integrated_ND_evo_blue.txt
Combined observations (symbols and regions):
Obs_integrated_ND_evo_red.txt
Obs_integrated_ND_evo_blue.txt
|
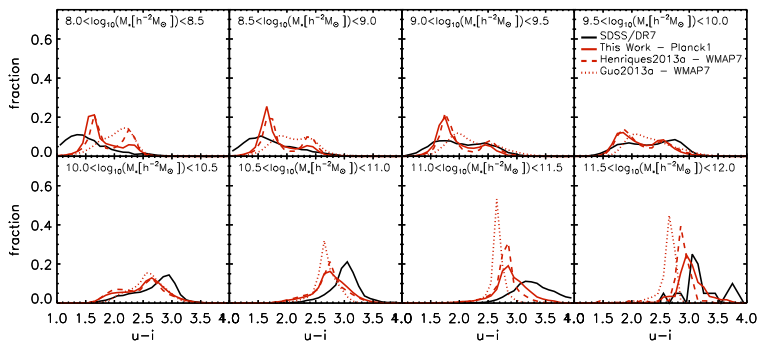
| Henriques2015a u-i hist: | Henriques2013 u-i hist: | Guo2013 u-i hist: | SDSS/DR7 u-i hist: |
| H15_hist_colour_z0.1.txt |
H13_hist_colour_z0.1.txt |
G13_hist_colour_z0.1.txt |
Obs_hist_colour_z0.1.txt |
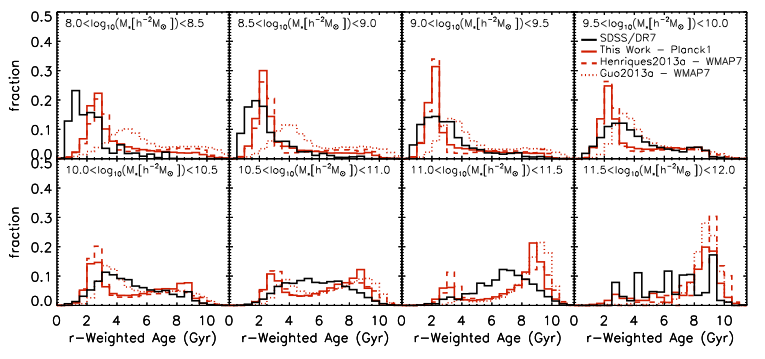
| Henriques2015a age hist: | Henriques2013 age hist: | Guo2013 age hist: | SDSS/DR7 age hist: |
| H15_hist_age_z0.1.txt |
H13_hist_age_z0.1.txt |
G13_hist_age_z0.1.txt |
Obs_hist_age_z0.1.txt |
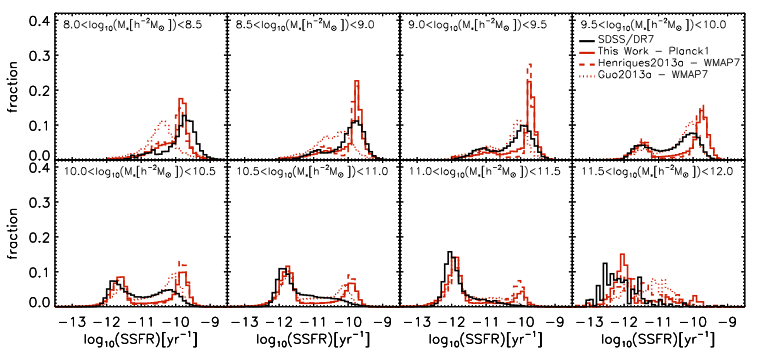
| Henriques2015a SSFR hist: | Henriques2013 SSFR hist: | Guo2013 SSFR hist: | SDSS/DR7 SSFR hist: |
| H15_hist_ssfr_z0.1.txt |
H13_hist_ssfr_z0.1.txt |
G13_hist_ssfr_z0.1.txt |
Obs_hist_ssfr_z0.1.txt |
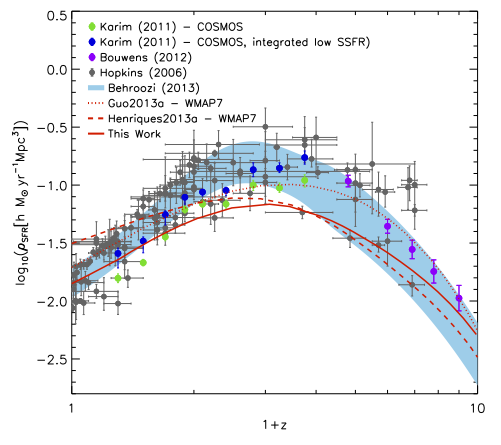 |
Henriques2015a star formation rate density: H15_sfrd.txt
Henriques2013 star formation rate density: H13_sfrd.txt
Guo2013 star formation rate density: Guo13_sfrd.txt
|
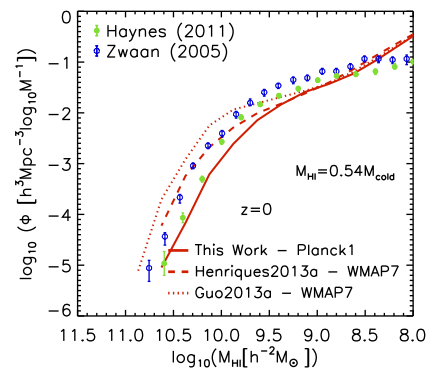 |
Henriques2015a HI mass function: H15_HI_MF.txt
Henriques2013 HI mass function: H13_HI_MF.txt
Guo2013 HI mass function: Guo13_HI_MF.txt
|
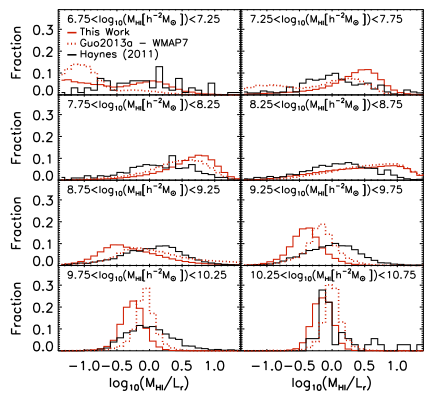 |
Henriques2015a HI/Lr histograms: H15_HI_Lr.txt
Guo2013 HI/Lr histograms: Guo13_HI_Lr.txt
|
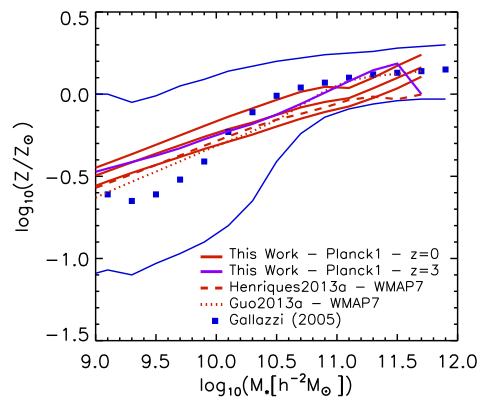 |
Henriques2015a metals in stars as a function of stellar mass: H15_metals.txt
Henriques2013 metals in stars as a function of stellar mass: H13_metals.txt
Guo2013 HI metals in stars as a function of stellar mass: Guo13_metals.txt
|
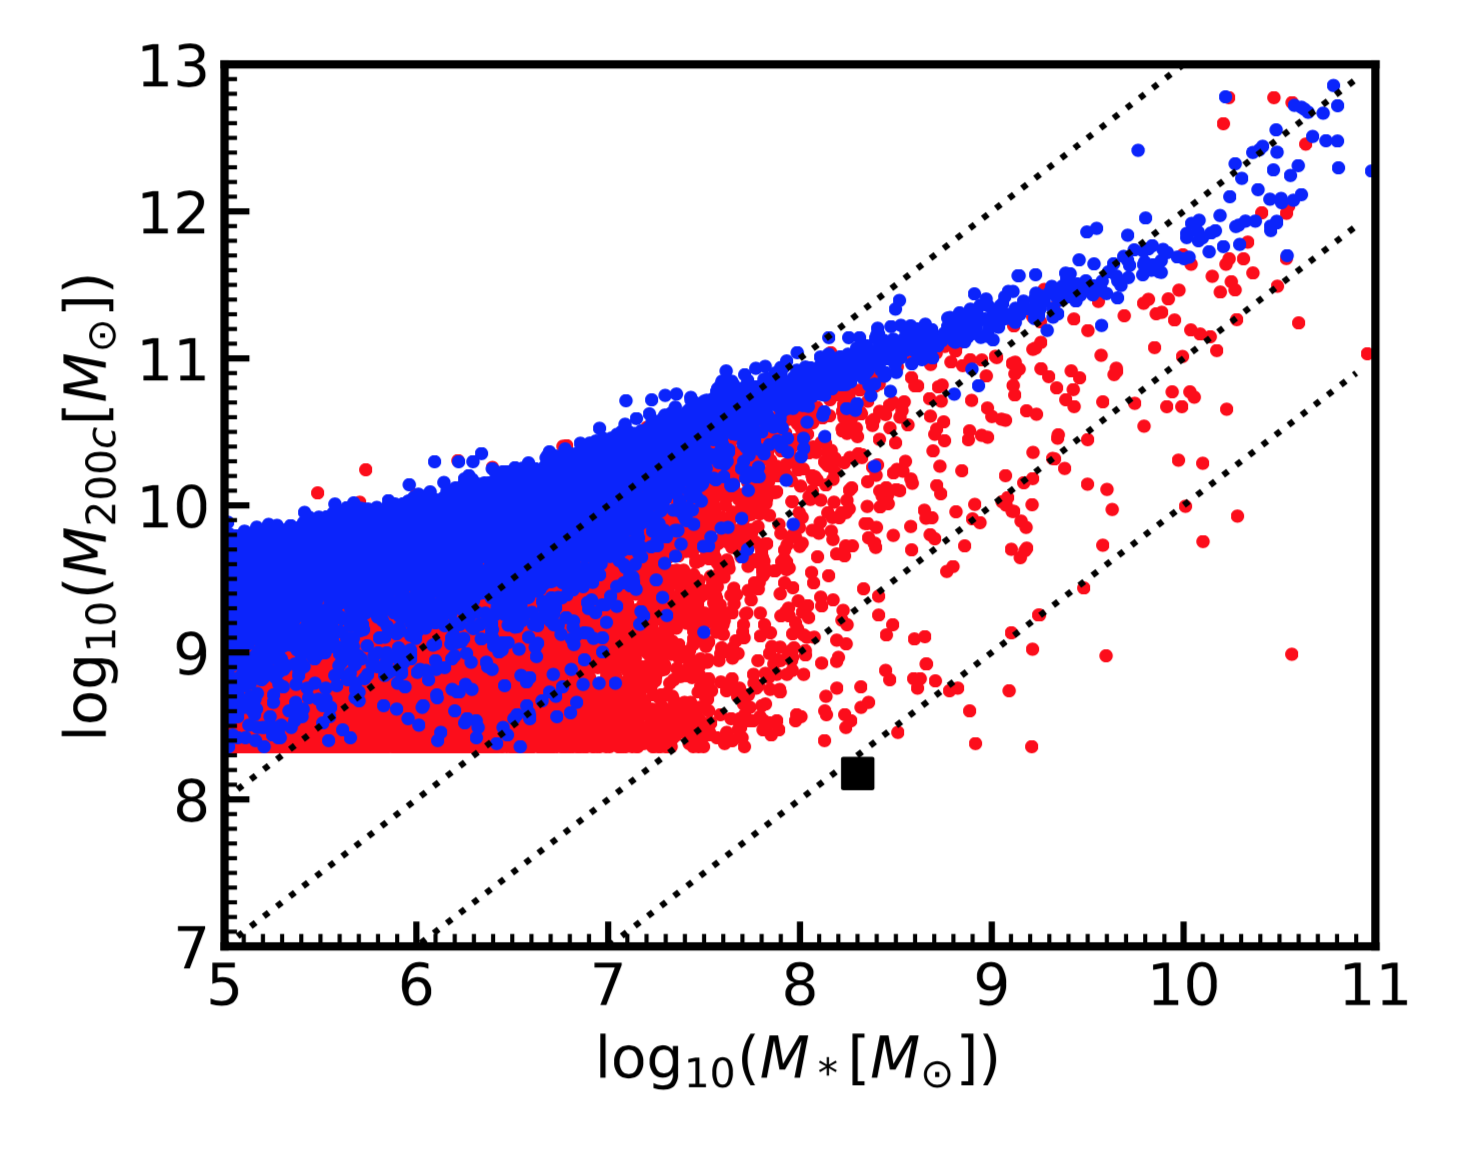
Blue: central galaxies, Red: satellites, Resolution limit: log10(Mvir/Msun)=8.4
Black: VanDokkum2018 galaxy lacking dark matter:
| Only Centrals | Centrals+Satellites |
| Only Centrals | Centrals+Satellites |