The MRObs provides access to a range of data products that significantly extend the types of analysis that can be performed on the classical Millennium Run output products.
The survey overview table on the main
MRObs portal provides access to the new data products we have created for each survey.
These data products include object lists derived from lightcones, model images, PSF kernels, scientific images, noise maps, RGB images, SExtractor detection and segmentation images, and SExtractor catalogs.
We also provide a detailed description of the simulation parameters for each survey.
Here we describe the nature of these various data products in more detail.
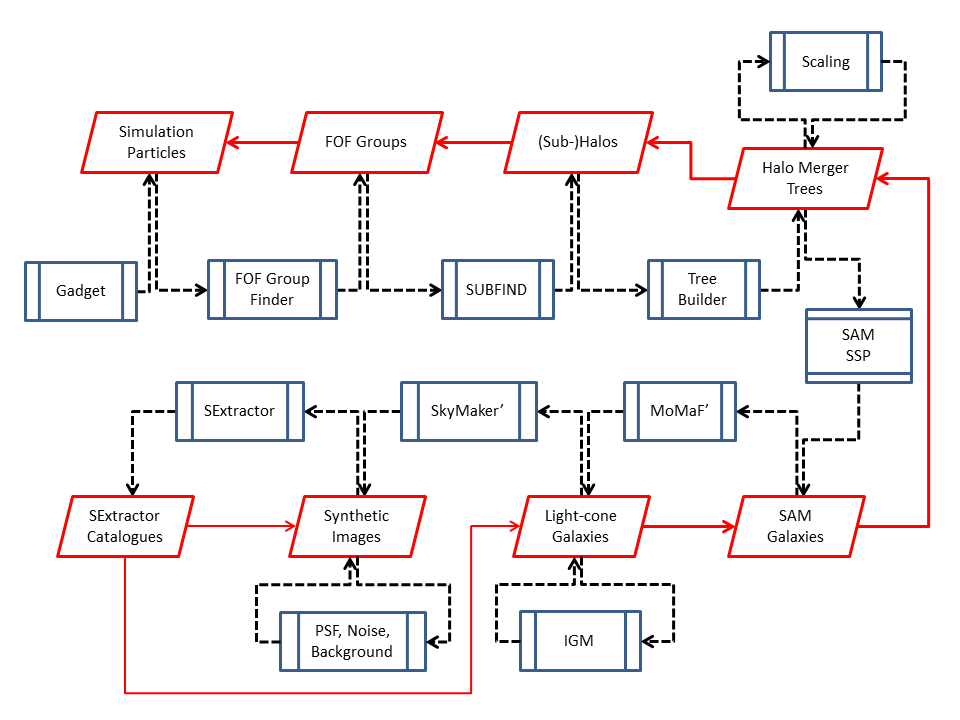
We do so based on the following diagram that shows the
simulation and post-processing pipeline used to produce the data products.
The red parallelograms show the various data products. Clicking such an element links to the corresponding section in this page.
MRObs Pipeline
Light cones contain galaxies with properties as they can be observed in realistic observations.
They are directly derived from the galaxy catalogues created using the semi-analytical galaxy formation models.
Our light cones are derived using a version of the MoMaF code of
Blaizot et al. (2005), that was
modified slightly as described in
Overzier et al. (2012).
Many of the light cones we provide access to were first described in
Henriques et al. (2012).
To serve as input to the image creation routines,
Overzier
et al. added structural parameters to those cones for representing inclination, position angles and apparent sizes.
The light cones created for Henriques
et al. were published in the Millennium database already.
The new light cones, such as those aiming at clusters will be published soon
.
See the
FAQ for more information on the location of the light cones and how to retrieve them.
The following animated GIFs are described in Overzier etal, Fig.6.
Object Lists
The light cones are used to generate the input to the SkyMaker code that we use to create our synthetic ``pre-observation'' images. Galaxies in the MRObs consist of disks and bulges with properties that follow from the model in a consistent manner. Skymaker requires as input a list of objects with a particular set of properties: position in the image plane, total magnitude of the object, bulge-to-total (B/T) flux ratio, bulge shape, bulge equivalent radius, bulge position angle, disk shape, disk scale length, and disk position angle. This input is a very good match to the parameters generated by our semi-analytic models, our light cones, and the survey description. The inclinations and position angles are determined by each object's intrinsic angular momentum vector and the angles of intersection of the lightcone with the simulation volume. The (apparent) disk scale length and the bulge radius follow from the intrinsic sizes predicted by the semi-analytic model and the angular diameter distance at the redshift of each source in the lightcone. The total (apparent) magnitudes for each object are based on the fluxes given by the lightcone, corrected for absorption by the inter-galactic medium (IGM), and, optionally, Galactic foreground extinction. The B/T is calculated from the ratio of the fluxes of the bulge and total in each band. Last, the position of each object is determined by its RA and DEC provided by the lightcone and the pixel scale of the image.
The object input list is generated by querying the database for the light cones that have the structural properties of the galaxies (projected sizes, inclinations and position angles) added. Each object list is registered in our survey data pages as a CSV table (extension .csv), together with the SQL query used to generate it (extension .sql). This query generally includes a choice of inter-galactic absorption model used to improve the realism of our catalogues at high redshift and/or short wavelengths. The IGM corrections are applied ``on-the-fly'' by interpolating over tabulated IGM-redshift data that has also been uploaded to the database (see the
FAQ for the location of the IGM tables).
Because we also provide the object lists (and the queries to make them from the MRObs lightcones), we invite users to use them as the basis for their own synthetic image simulations.
SkyMaker model images
In the MRObs we use a slightly modified version of
SkyMaker to create our synthetic ``pre-observation'' images.
SkyMaker was created by E. Bertin, and is able to create fully realistic images from an input object list, including many instrumental effects, and an option to add stars. Skymaker was modified to efficiently handle our object input lists (typically millions of objects long) in .csv format. The current MRObs pipeline uses SkyMaker to only produce our ideal model or ``pre-observation'' images. The noise and other instrumental effecs are added at a later stage using separate custom scripts for flexibility. This allows us to provide the user with a range of data products that resemble the final synthetic images more and more closely.
Analogous to the object lists above, we provide our model images such that users have the freedom to apply their own noise, backgrounds, point-spread-functions, exposure strategy, etc. The model images can be found in the 'PRE' column of the survey data tables.
Final Science Images
The final synthetic science images are produced in various steps. We apply PSF convolution and rebinning of the model images as desired.
PSFs are sometimes based on stars taken from the actual survey that we are trying to reproduce with the simulations. Other times they are created using a PSF simulator corresponding to the instrument we are modeling, or generated using simple functions (e.g. Gaussian). We provide users with the actual PSF kernel with which the model image was convolved. This will allow users to retrace our steps, and to take the exact PSF in to account when analyzing the sizes and shapes of objects detected in the synthetic images.
Sky backgrounds, dark current, Gaussian read-out noise, CCD gain, and zeropoints are based on the characteristics of the observation site and the specific instrument we are modeling. Dither strategies, exposure times, and number of exposures are used to realistically predict or reproduce the data quality (signal-to-noise) of the survey we are simulating. For some surveys, we make use of real noise images to impose an identical noise on our simulated images (e.g. CANDELS, HUDF). Some surveys are modeled after existing surveys, but with drastically increased exposure times allowing users to study the effects of differnt image depths.
The resulting science-quality images can be found in the "SCI" column of the data tables. Users should be aware that the exact details on how each of the simulations was performed may differ depending on the survey. We suggest checking the descriptions on the relevant survey pages for those details.
RGB Images and MRObs "Deep-Zoom" Image Browser
We provide RGB false-colour composite images based on the simulated science images. The colour images are produced using the package
STIFF, also written by E. Bertin. The images in (extension .tif) can be found on the survey pages. Users can also generate their own colour images by running STIFF on a set of simulated science images.
The RGB images are efficiently displayed and inspected using the deep-zoom image pyramids in our MRObs Image browser. A static, public version of the browser allows users to view different simulated data sets and zoom and pan around the images. Access to a private version of the browser allows users to interactively explore the rich MRObs data and the underlying higher-level information available in the Millennium database. For example, users can select an object in an image, and retrieve a wide range of photometric and physical details pertaining to that object in the Millennium simulations. See the
FAQ for information on how to get access.
SExtractor Images and Catalogs
In order to demonstrate the potential of our simulated observations for a wide range of scientific applications, we have processed our simulated surveys using
SExtractor (Bertin & Arnouts 1996). We provide the detection images that were used for object detection as well as the segmentation images output by SExtractor, where appropriate. Catalogs extracted from our synthetic images are available for download. These can be retrieved from each survey page. Naturally, users are free to construct their own object catalogs from our simulated images.
The SExtractor catalogs we provide have also been uploaded to the Millennium Database, which allows convenient cross-matching between objects detected in the simulated images on one hand, and objects in the lightcones, semi-analytic catalogs, and dark matter catalogs on which the simulation is based. This allows one, in principle, to employ the strength of the Millennium relational database to follow objects along the entire chain of processing steps from 'observed' objects to N-body dark matter halos, and everywhere in between. See the
FAQ for the location of the SExtractor catalogs in the Millennium database and for more information on how to cross-match them with higher-level products in the database.
DISCLAIMER: When using any kind of data from the MRObs, users should keep in mind that they are part of a new and evolving experiment at the interface of simulations and observations. Our mock images and surveys attempt to approach real observations while balancing accuracy and practicality. We will continue to make updates and improvements based on feedback from users, requests, and more accurate simulation techniques. Future versions of the simulated data sets as well as an expanded set of simulated surveys for use by the community will be announced through this web portal and in forthcoming publications.